Want a real-world look at our survey reporting?
The video on the right gives you a visual tour of our employee feedback platform, showing you how to navigate it and leverage powerful survey features to create a more engaging workplace.

Our reporting dashboard is your centralised hub for employee sentiment analysis. Get instant access to important metrics, from participation rates to engagement scores. We offer a clear, actionable snapshot of how your employees experience your company.

For us, user experience comes first. We’re all about simplicity and making your life easier. Our tech is built with these guiding principles: “Easy to understand. Easy to share. Easy to take action.”
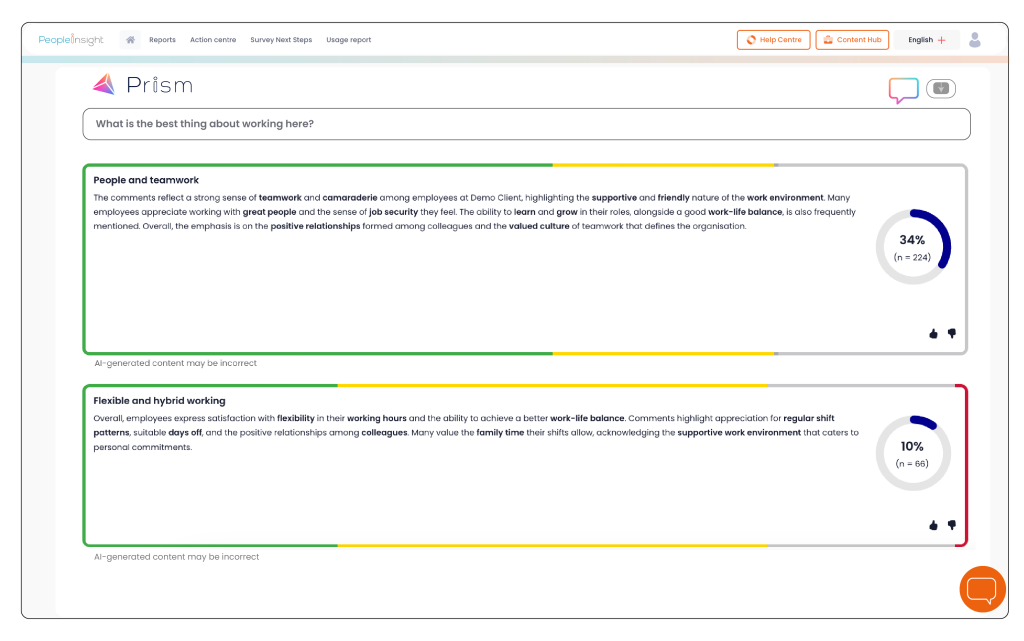
We value capturing valuable data, even from open-ended responses. Our reporting dashboard’s cutting-edge AI tool, Prism, breaks down and analyses qualitative, qualitative and historical survey data, highlighting recurring sentiments and categorising them as positive, neutral or negative. Learn more about Prism AI below.
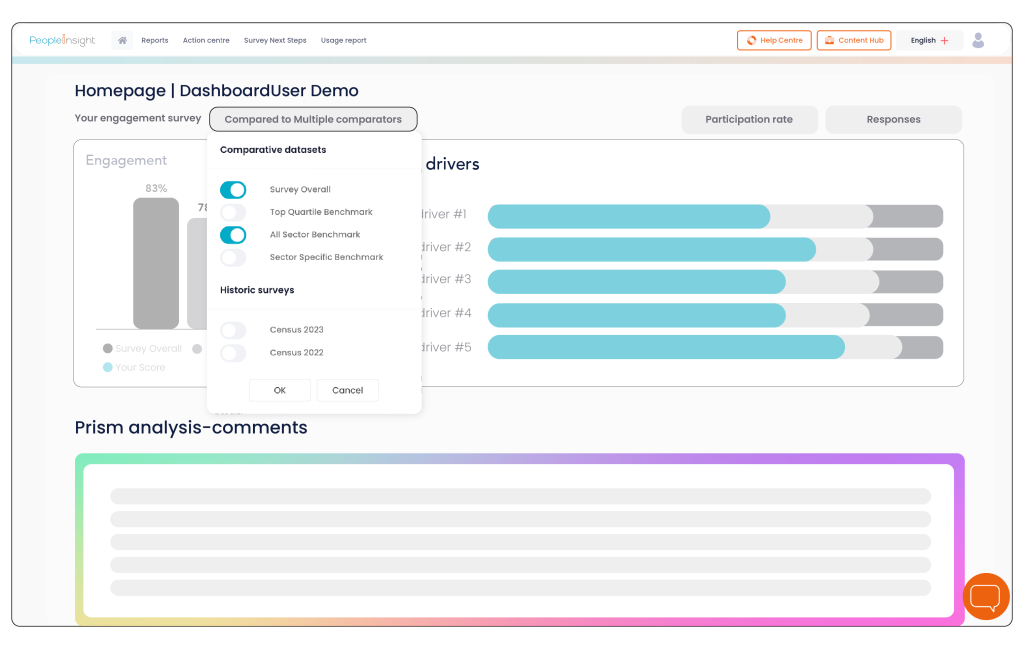
Data is at its most powerful when it has context. That’s why our robust benchmarking feature compares your results to others in your sector, from universities to charities to financial services and beyond. We help you to understand where you stand and how you can rise above the rest.
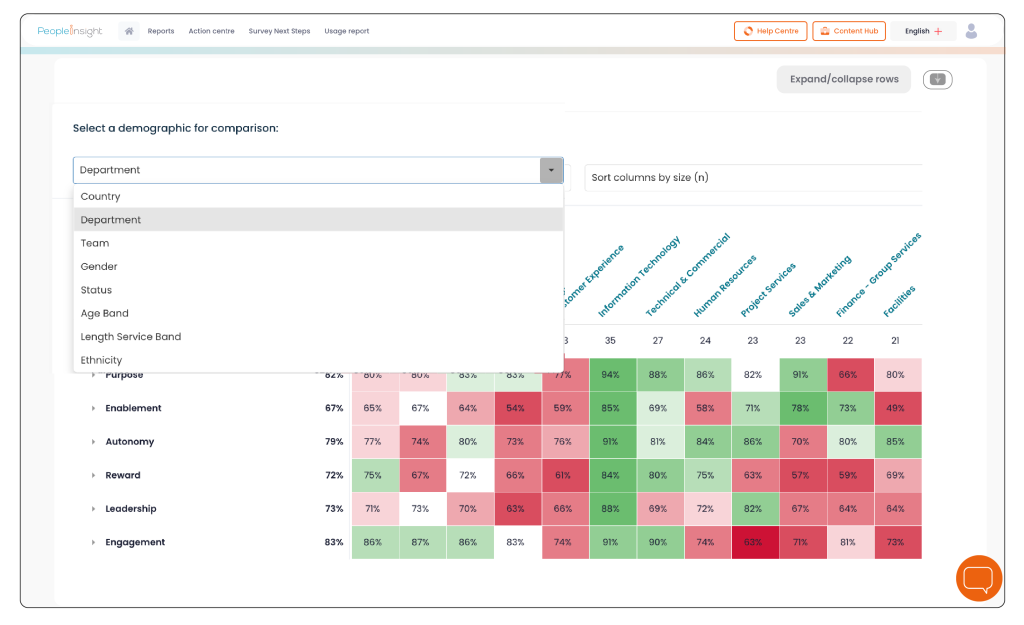
Our dashboard enables you to compare and segment survey data by demographics such as gender, age and seniority, revealing how the employee experience is being perceived across various groups.
Your survey will produce an incredible amount of information but information overload is a very real risk.
We want you to have a clear image of your company culture and key drivers. Our ‘iDeck’ feature condenses all this valuable information into one presentation, ready to be presented and shared company-wide.
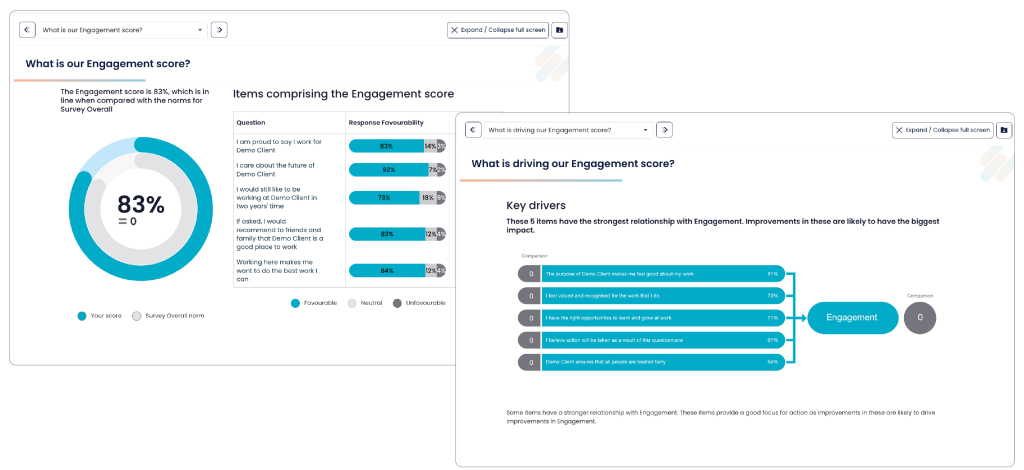
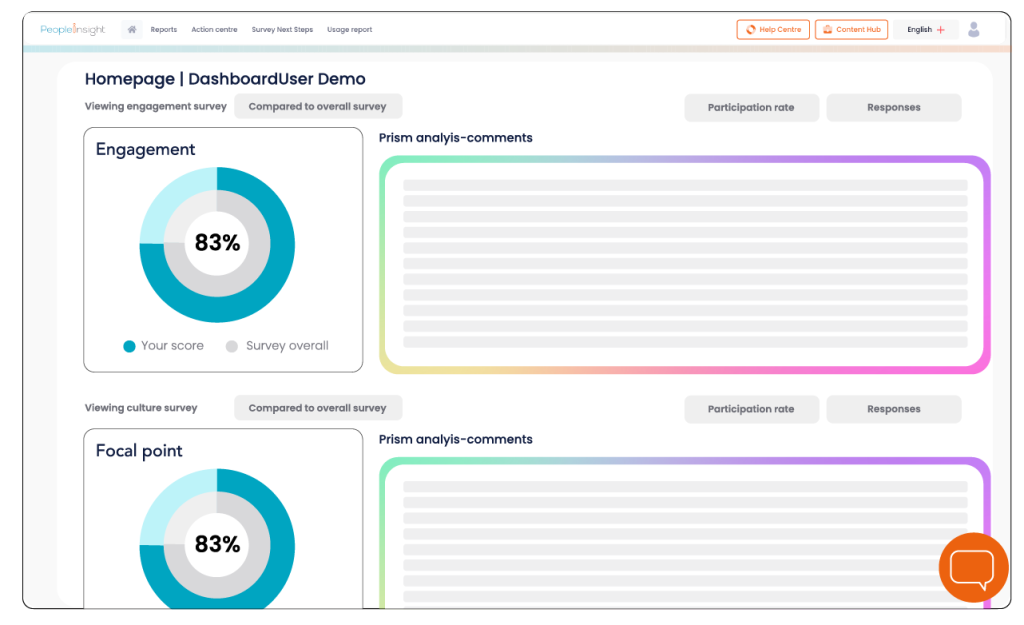
People Insight’s multi-survey dashboard enhances your employee surveys by offering:
To dive deeper into how our platform helps you to plan and view actions based on survey data, check out our Action centre.
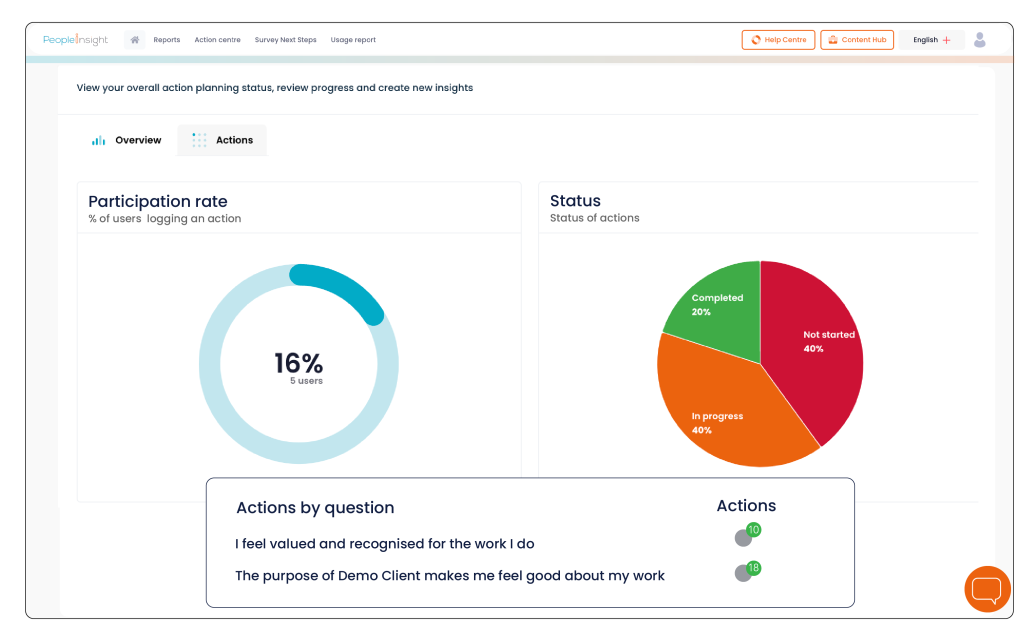
Our reporting dashboard complements our in-house expertise to enhance decision-making, drive engagement and improve organisational culture based on survey feedback.
Our people and our tech give us our edge, and they work well together to provide an incredible survey experience. From Prism to consultants, you’ll get all the support and insights you’ll need.